Saved Scripts & History
Zentro keeps two kinds of query persistence: Saved Scripts (explicitly named .sql files, reusable, autosaved as you type) and the Audit Log (an automatic record of every query executed).
Saved Scripts
Saving a Query
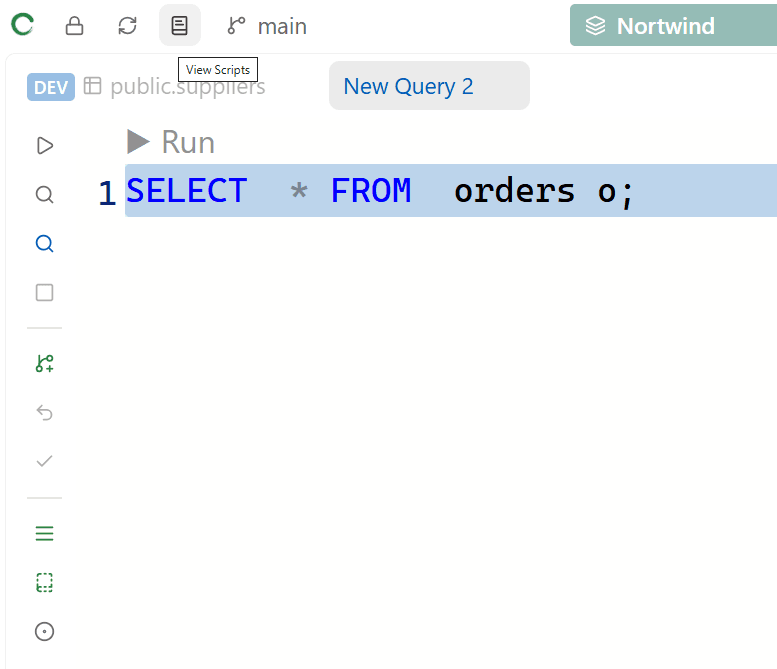
With a query tab open, press Ctrl+S to save it as a script under the tab's current name. To choose a specific name, double-click the tab title to rename it first, then save.
You don't usually need to save manually — Zentro autosaves query tabs automatically: 2 seconds after you stop typing, and again every 15 seconds while the tab has unsaved changes. Autosave also runs best-effort on every open tab when you quit the app.
Saved scripts are:
- Stored locally on your machine as
.sqlfiles (not synced to any cloud) - Scoped to the project and database connection you had active when you saved them — the same script name can exist independently under different connections
- Editable — open one, make changes, and it's kept up to date automatically (or press
Ctrl+S)
Finding Saved Scripts
The Scripts panel is a tab in the left sidebar (below Explorer). It lists every script saved for the current project + connection, with a filter box at the top that matches both script names and their SQL content.
Click a script to open it in an editor tab (or focus its tab if it's already open). Hover a script to preview its content without opening it.
Organizing Scripts
There are no folders and no in-place rename/duplicate action on a saved script itself. To rename a script, rename its query tab (double-click the tab title) and save again — this creates/updates the script under the new name. To remove one, hover it in the Scripts panel and click the trash icon that appears.
Use descriptive names to keep scripts organized (e.g. users_by_signup_date, active_subscriptions_summary).
Audit Log
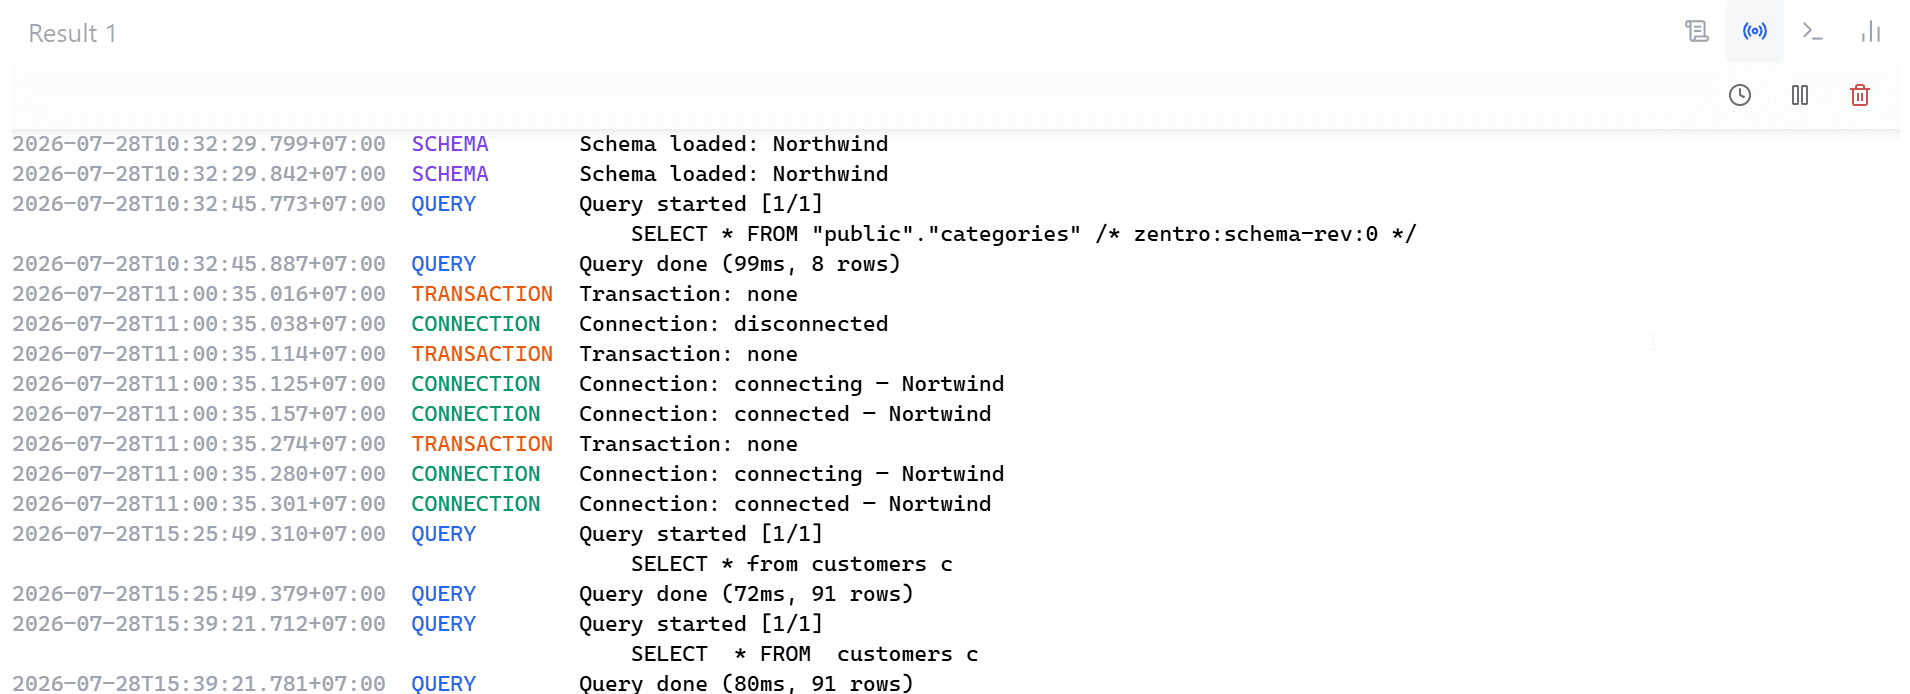
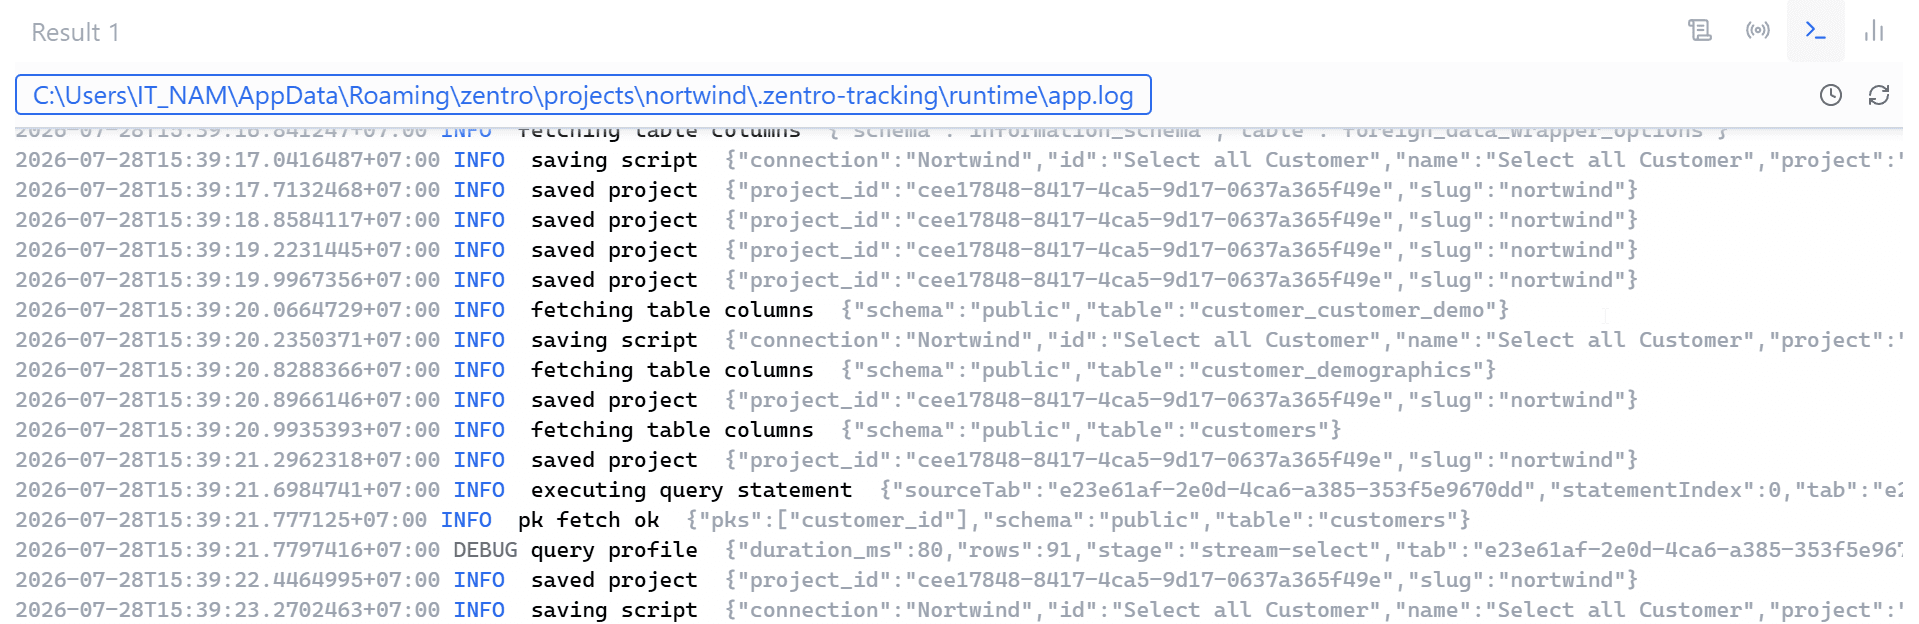
Zentro automatically records every query it executes, per project. Open it from the bottom panel with Ctrl+Shift+L, or via the Audit tab next to Realtime and App Log.
Log Entries
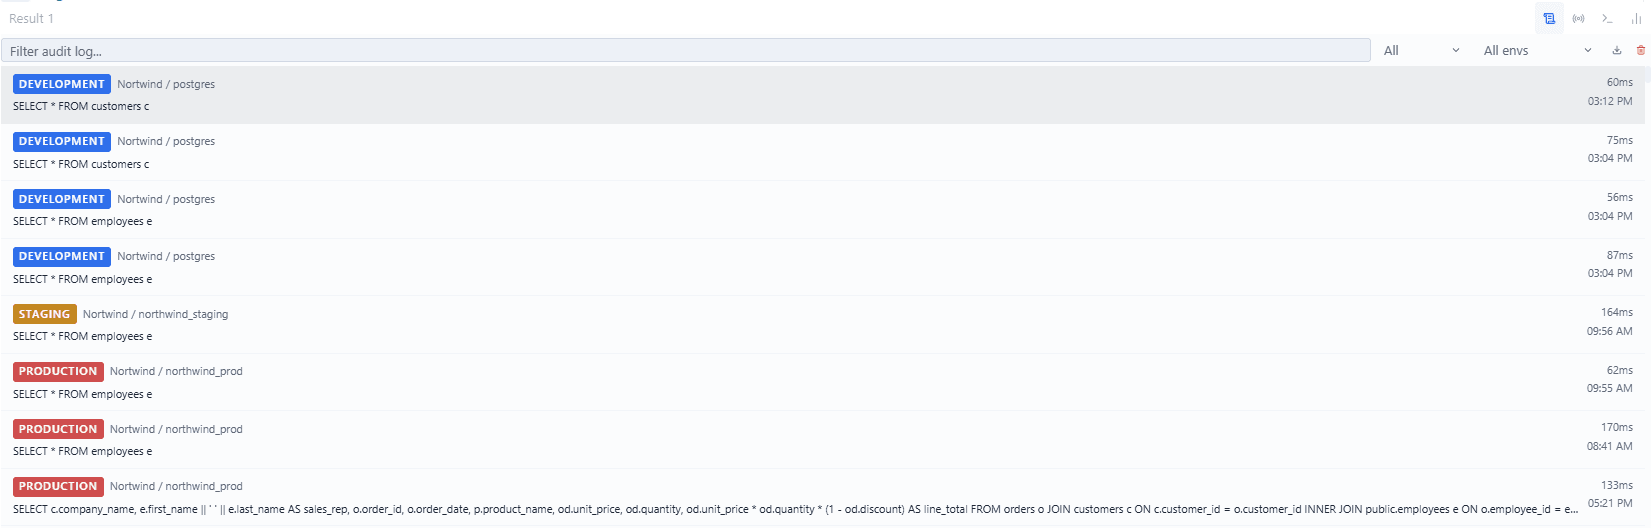
Each entry shows:
- Environment badge, connection profile, and database
- The executed SQL statement
- Duration and the time it ran
- The write-safety reason shown, if the query needed a confirmation step
- The error message, if it failed
Right-click an entry for Paste Into Editor, Copy SQL, Open In New Tab, and Pin/Unpin (pinned entries stay at the top).
Filtering, Exporting, and Clearing
The filter bar above the log lets you search by text, filter by status (success/error), and filter by environment. The toolbar also has:
- Export as JSON — saves the currently loaded entries to a file
- Clear — permanently wipes the entire audit log (not just the filtered view, and not scoped to one connection) — there's no undo, so export first if you need a record.
Search Across Scripts
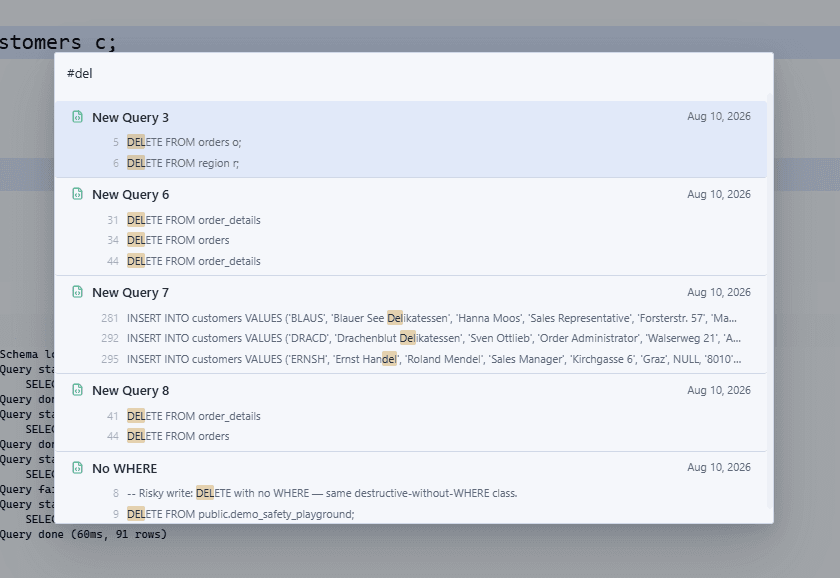
Press Ctrl+E to open Context Search (Zentro's Spotlight-style palette), then type # to switch into script search mode — it searches both saved script names and their SQL content, showing the matching line for content hits. Press Enter or click a result to open it (or jump straight to the matching line if it's already open).
Context Search has other prefix modes too — press ? inside it any time for the full list (schema objects by default, # scripts, > commands, @git branches, @env environments, : go to line).